
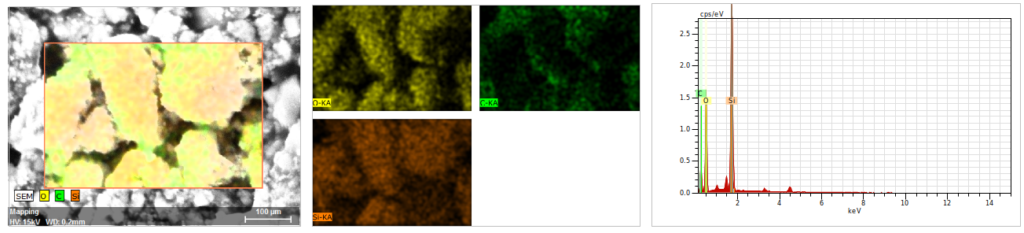
The first step is to image the surface of a sample and to define the area of intrest (right picture). Second is to map the area of interest using the EDX tool which detects each element present at the surface (middle picture). A graph output is available from the detection indicating qualitatively the relative concentration of each element.